Watching the Black Box: How I Found 1,514 Wasted Tokens in My ADK Agent
I built an ADK agent event visualizer and immediately caught my own agent wasting 1,514 tokens on LLM calls it never needed. Tracing revealed what the black box was hiding.
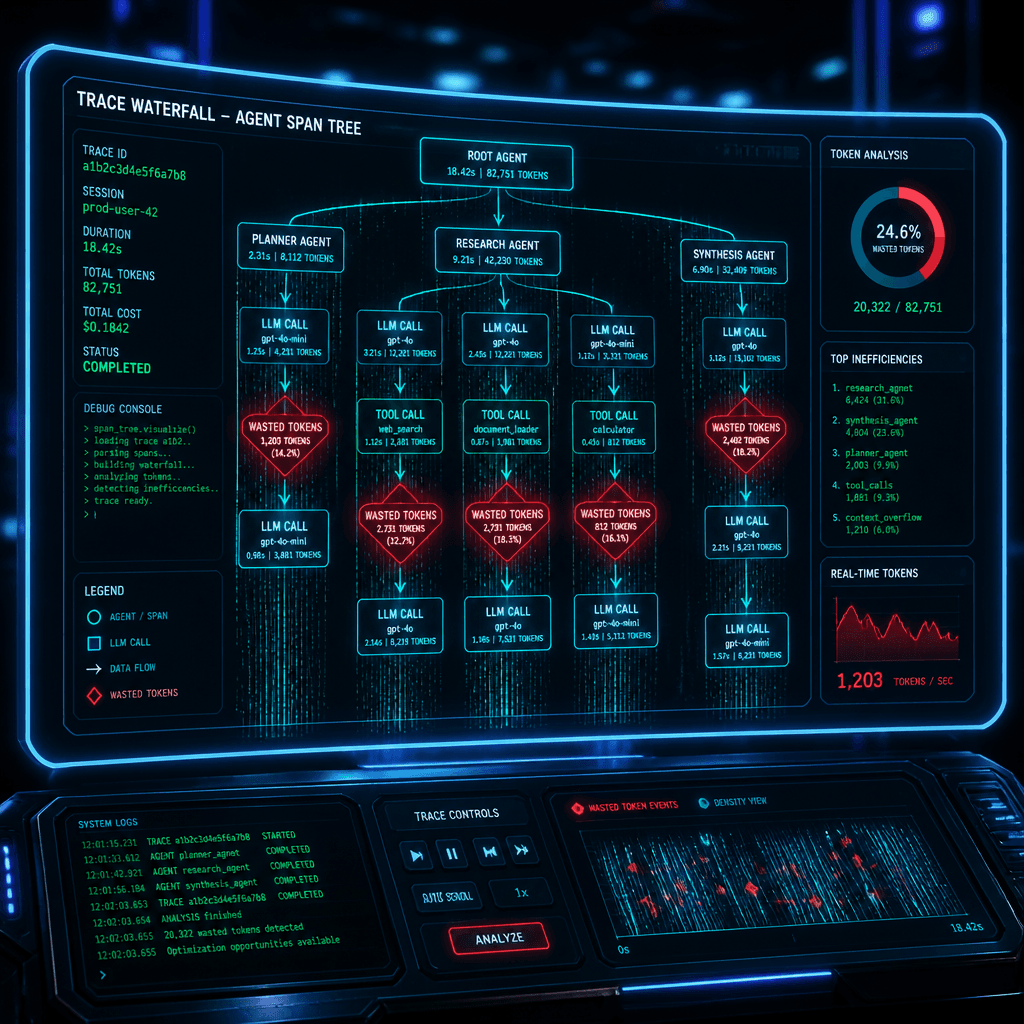
The Black Box Problem
AI agents are black boxes. You send a prompt in, you get a response out. What happens in between? The agent might call three LLMs, execute five tools, or loop internally — but you have no idea unless you build observability.
This is especially true for multi-agent systems built on the Google ADK framework. Sub-agents call sub-agents. Tools call LLMs. LLMs call more tools. The orchestration is powerful, but the internals are opaque.
I had just finished building **illustra-go** — a two-agent image generation system:
User Input → [Prompt Agent (Gemini)]
           → generated_prompt
           → [Image Gen Agent + Stability AI Tool]
           → GCS Upload → Public URL
It worked. Images were generated, URLs were returned. But I had no idea how it was working. Was the image_gen_agent making one LLM call? Three? Ten? Were tokens being wasted? I couldn't tell.
So I built something to look inside the black box.
Building the Tracer
I wrote **tracer** — an embeddable Go module that captures ADK agent events via OpenTelemetry and renders them as a live-updating trace waterfall in the browser.
Architecture:
ADK Agent
   │
   ▼
OTel SpanProcessor / LogProcessor
   │
   ▼
Normalizer (OTel → internal Event)
   │
   ▼
EventBus (buffered chan, non-blocking)
   │
   ├── Store (append-only ring buffer per session)
   └── SSE Broker (per-session subscribers, tail replay)
            │
            ▼
       Web UI (SSE consumer — vanilla JS)
No npm, no build step, no external JS. Just go run . web api a2a tracer and a browser tab.
Integration is minimal:
tr, _ := tracer.New(tracer.Config{BasePath: "/tracer"})
defer tr.Shutdown(ctx)

telemetryProviders, _ := telemetry.New(ctx,
    telemetry.WithSpanProcessor(tr.SpanProcessor()),
    telemetry.WithLogProcessor(tr.LogProcessor()),
)
telemetryProviders.SetGlobalOtelProviders()

mux.Handle("/tracer/", tr.Handler())
I mounted it on the illustra-go server, ran an image generation, and opened the trace waterfall.
What the Trace Revealed
The waterfall was illuminating. Here's what the image_agent execution looked like:
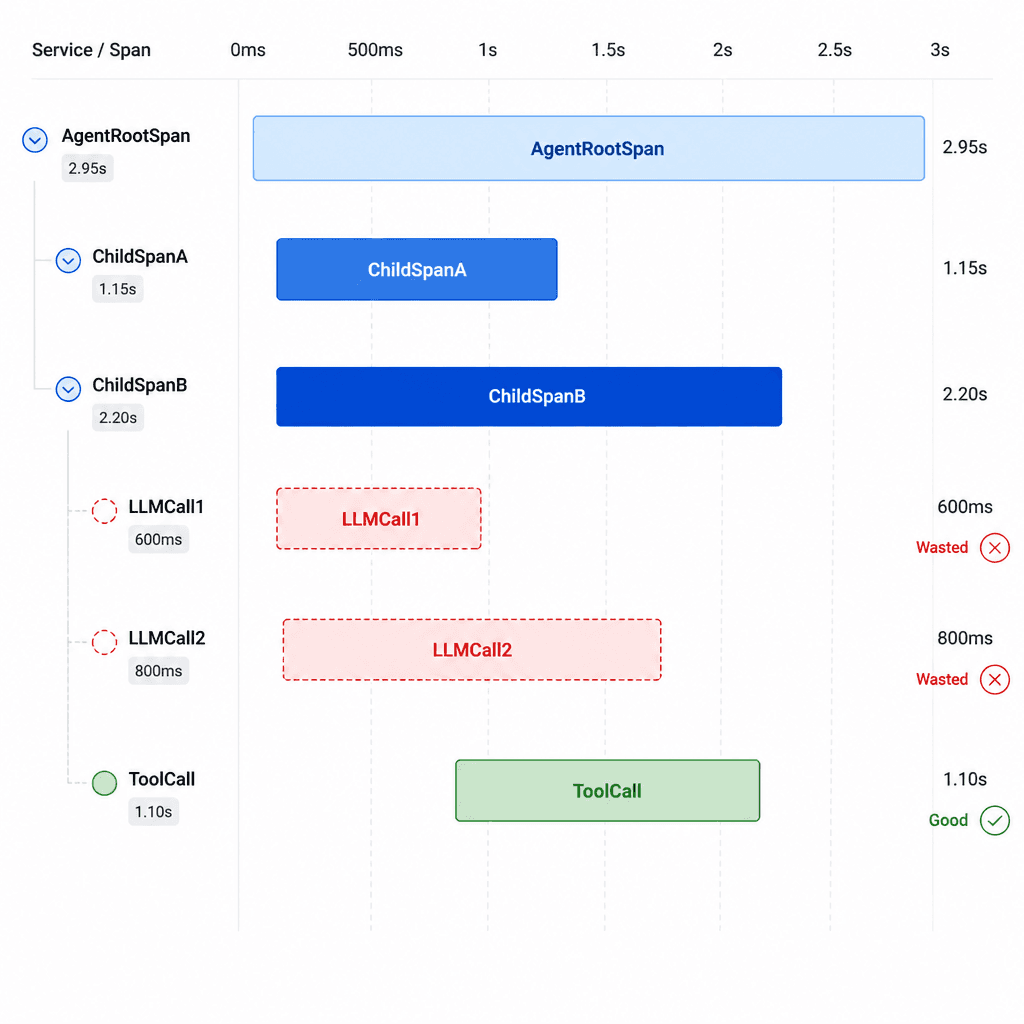
The image_agent orchestrator ran two sub-agents sequentially:
1. `prompt_agent` — A single LLM call to generate a detailed prompt. ✅ Necessary.
2. `image_gen_agent` — Three operations inside it:
- LLM call #1 (1.84s, 715 tokens) — The agent decided it should call generate_image. ❌ Unnecessary.
- `generate_image` tool (9.0s) — Actually generated the image. ✅ Necessary.
- LLM call #2 (1.22s, 799 tokens) — Formatted "here's your URL" response. ❌ Unnecessary.
Why Was This Happening?
The image_gen_agent was defined using ADK's llmagent:
agent, err := llmagent.New(llmagent.Config{
    Name:        "image_gen_agent",
    Model:       model,
    Description: "Generates images using Stability AI from a detailed prompt.",
    Instruction: `Use the generate_image tool with the prompt from state: {generated_prompt}
After the tool returns an image URL, respond with only the URL.`,
    Tools: []tool.Tool{stabilityTool},
})
The llmagent wrapper routes every decision through the LLM. Even though the instruction explicitly says "call this tool with this prompt", the framework still requires an LLM turn to:
1. Parse the instruction and decide to call the tool
2. Format the tool call arguments
3. After the tool returns, formulate a response
But for this agent, no LLM judgement is needed. The prompt is already generated. The tool to call is fixed. The response format is a URL. The LLM is doing predictable, mechanical work that could be replaced with direct code.
The 1,514 Token Breakdown
The wasted tokens per image generation:
At scale — say 10,000 image generations — that's 15 million tokens and 8+ hours of unnecessary latency.
The Fix: Direct Tool Invocation
The solution was to replace llmagent with a custom agent that reads the prompt from state and calls the tool directly:
type directImageAgent struct{ tool tool.Tool }

func (a *directImageAgent) Run(ctx context.Context, req agent.Request) (agent.Response, error) {
    prompt := req.State.Get("generated_prompt")
    result, err := a.tool.Run(ctx, map[string]any{"prompt": prompt})
    if err != nil {
        return agent.Response{}, err
    }
    url := result.(map[string]any)["image_url"]
    return agent.Response{
        Message: agent.NewTextMessage(url),
    }, nil
}
No LLM calls. Zero token waste. The agent just reads state, runs the tool, returns the URL.
The Lesson
Agent telemetry isn't optional. Before tracer, I had no idea my agent was wasting 1,514 tokens per invocation. The agent "worked" — images were generated, URLs returned — but it was silently burning money and latency.
Three things every agent builder should do:
1. Instrument early — Add observability from day one. Don't wait until you suspect a problem.
2. Right-size the agent type — Not every agent needs an LLM. If the logic is deterministic (read state → call tool → return result), use a direct agent, not llmagent.
3. Measure the per-call cost — ~1,500 tokens per image doesn't sound like much until you multiply by 10,000.
The tracer package is open source on GitHub. Illustra-go is too. Both are MIT-licensed.
If you're building ADK agents, mount the tracer. You might be surprised what your black box is hiding.